Last updated on August 20, 2025
Producthero Insights – Get additional control over your campaigns
When running Google Shopping campaigns, marketers aim to optimise them by reducing costs and maximising Return on Ad Spend (ROAS). To achieve this, it is crucial to stay in control of campaign performance, and that’s where actionable insights make all the difference.
That’s why, as part of our commitment to providing innovative and user-friendly solutions within our all-in-one platform, we’re excited to introduce the upcoming Producthero Insights Panel.
Producthero Insights Panel empowers advertisers by offering you additional control over your campaigns. This new menu enables you to make informed decisions and drive better results. You will be able to access the Producthero Insights Panel by navigating to the Insights tab located on the bottom left sidebar of the Producthero Platform (see image below).
New Insights dashboard: Why insights are crucial for campaign optimisation
The new Insights Panel streamlines multiple dashboards into one cohesive interface, providing advertisers with essential tools to:
- Make data-driven decisions
- Identify potential opportunities and optimise campaigns
- Manage budget allocation effectively
- Have a better understanding of customer behaviour
The first feature introduced in this panel is PMax Insights, a dashboard that provides detailed channel distribution data for Performance Max (pMax) campaigns. These campaigns are often regarded by marketers as a ‘black box,’ making this new transparency a game-changer.
PMax Insights: Easily gain control over Performance Max campaigns
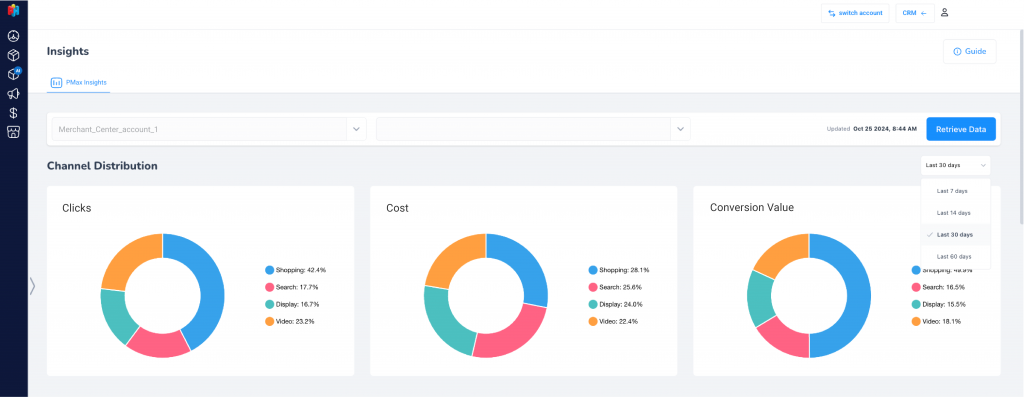
Performance Max campaigns, though powerful, are often criticized for being a “black box.” While one of their key strengths is the ability to serve ads across multiple Google network channels within a single campaign (as shown in the image below), the lack of channel-specific performance data in Google Ads poses a significant challenge.
Until now, advertisers could only access aggregate campaign results in Google Ads —a broad view that made it difficult to fine-tune strategies or address problems within individual channels. This is where the Producthero pMax Insights dashboard comes into play.
PMax Insights dashboard provides detailed channel distribution information, allowing you to discover optimization opportunities or potential underperformance issues. This dashboard is accessible to all our customers (both basic and PRO users), ensuring everyone can leverage these insights to enhance their campaign performance.
Producthero’s PMax insights are generated by combining multiple Google Ads performance reports, which are then analysed to provide insights that will make it easier for you to identify and understand which placements or formats are driving results and which ones are failing.
Additionally, accessing this data is pretty straightforward. There’s no need to install or configure additional components. Simply select your Google Ads and Merchant Center accounts, and click the “Retrieve Data” button to get started.
In addition to its user-friendly interface, the Producthero team has developed a dedicated guide with actionable solutions to address common challenges, such as excessive spending on certain placements or over-allocation of budget to branded search terms.
PMax Insight dashboard components
The pMax insights dashboard comprises four different charts or graphics:
- Channel distribution: The pie charts show the distribution of the clicks, cost, and conversion value of each channel. This way, you can easily see in an overview how your budget is allocated between the channels.

- Channel distribution over time: The time series chart displays the evolution of budget allocation across channels over time, making it easy to identify spikes in specific placements. This provides valuable insights into how these shifts in distribution have influenced performance throughout the period.
- Channel distribution per campaign: This view breaks down budget allocation by campaign. It provides a clear overview of the distribution of resources across channels. It enables you to quickly pinpoint campaigns that may require optimization for improved performance.
- Campaign performance: The pivot table displays results by placement, allowing you to see the ROAS for each channel. This helps you identify underperforming campaigns and make informed strategic decisions.
Upcoming features
Launching the Producthero Insights Panel is a big step forward for campaign optimisation. By providing actionable insights and user-friendly tools, this feature empowers advertisers to move beyond the limitations of aggregate data, gaining granular control over their campaigns.
And this is only the start. The Producthero team is already working on expanding the Insights Panel with additional features and dashboards, ensuring you stay ahead in your campaign management.

